Session monitoring in Toad Edge
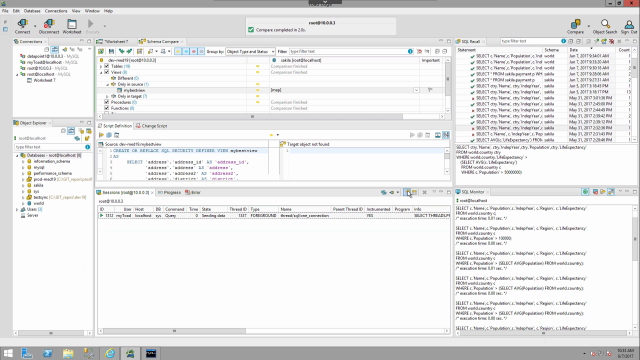 04:29
04:29
Related videos
Toad Edge licensing for trials and renewals
Quest Product Technologist, Robert Pound, reviews how to install a license for Toad Edge customers. Add or update licenses in Toad Edge or on Toad World.
03:23
Toad Edge installation for Mac
Watch how to install Toad Edge for OS X. We'll cover basic installation of Toad, discuss system requirements, and where to get more installation information.
03:07
Make the most of your JSON data in Toad Edge
Learn how to make the most of your JSON data in Toad Edge.
02:40
How to view and modify user privileges in Toad Edge
This short video shows how to view and modify user privileges in Toad Edge in two ways: per object or per user.
04:53
How to use the SQL Recall feature in Toad Edge
This video describes the SQL Recall feature in Toad Edge, including how to sort and clear entries, how to use recalled statements, and how to pin statements for...
02:42
How to use text and object search in Toad Edge
Learn how to use text and object search in Toad Edge, the solution from Quest that provides simplified database development for MySQL environments.
04:12
How to set up a Quest account to access your Toad products
Learn how to set up a Quest account to access your Toad products.
02:33
How to compare database schema in Toad Edge
This video shows how to compare database schema in Toad Edge. See different ways to open the tool, how to filter and group different aspects of the database, an...
09:08
Getting started with connections in Toad Edge
Learn how to get started with connections, connection properties, and importing and exporting connections in Toad Edge.
04:54
How to work with objects in Toad Edge
In this video you can see how to work with object explorer, object details, filtering and searching for objects, linking windows, and more in Toad Edge from Que...
03:23
Understanding the user interface in Toad Edge
This video shows highlights of the user interface in Toad Edge, including how to change the layout, manipulate views, and understand linked windows.
03:57